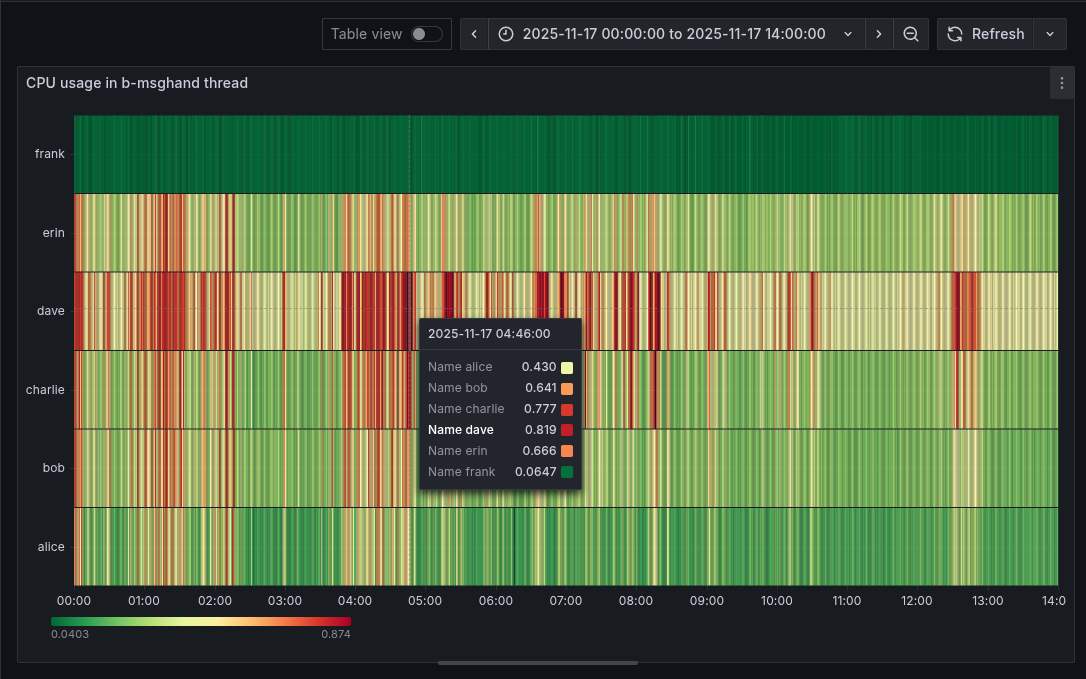
While looking at a peer-observer dashboard for time spent in the b-msghand (P2P message handling thread) of Bitcoin Core, I noticed that some of the nodes (especially dave with many connections) were active in that thread for more than 500-700ms per second (i.e 50% - 70%) on e.g. 2025-11-17.
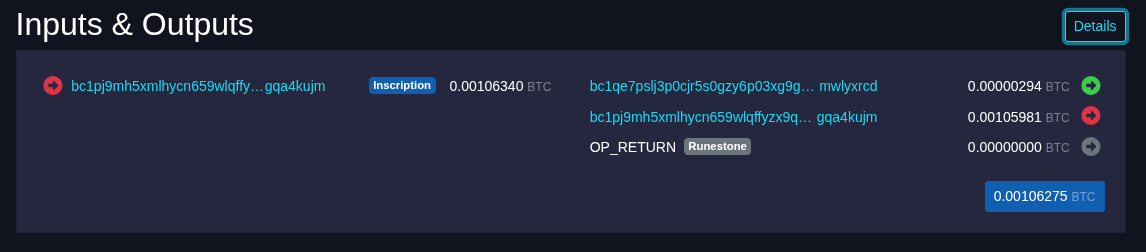
In my debug.logs I noticed a lot of sending tx (352 bytes) peer=X and was confused at first. I interpreted this as us responding to a getdata requesting 22 transactions with sending the same 352 byte transaction 22 times. Looking at received getdata for: wtx shows that we only log the first wtxid being requested. These were probably all different transactions being sent, they just all happened to be 352 byte.
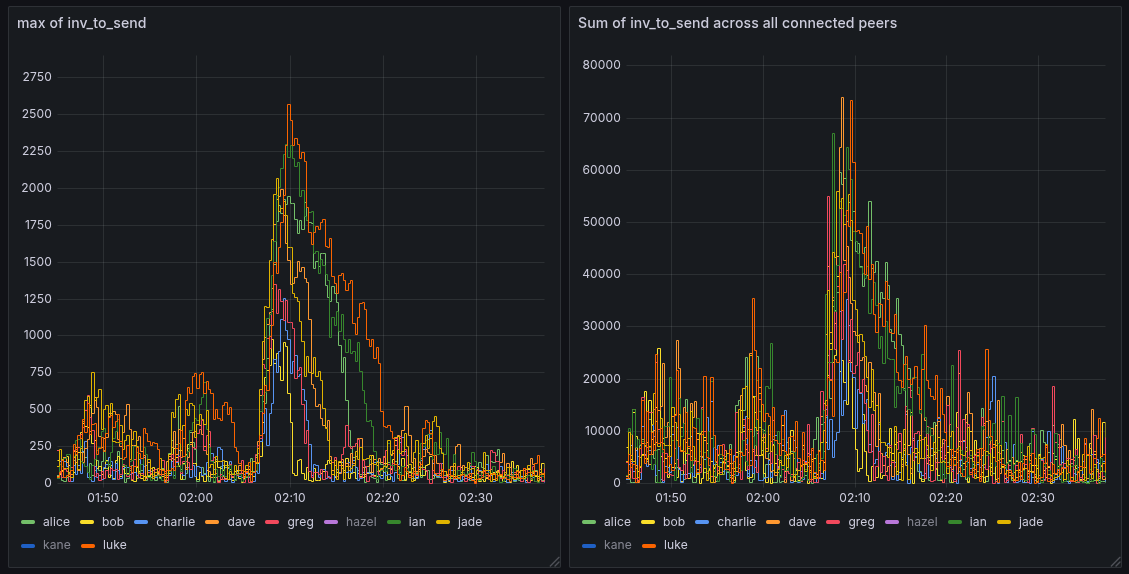
If you backport #33448, then tracking the value of bitcoin-cli getpeerinfo | jq '[.[].inv_to_send] | max' might be informative. (Normal behaviour should be less than 5k, values below 10k or 20k should still result in acceptable performance though)
The max tells you what is in queue to e.g. a spy-peer. The sum tells you a bit more about the total load that (sorting and) sending invs has on the node across all peers.
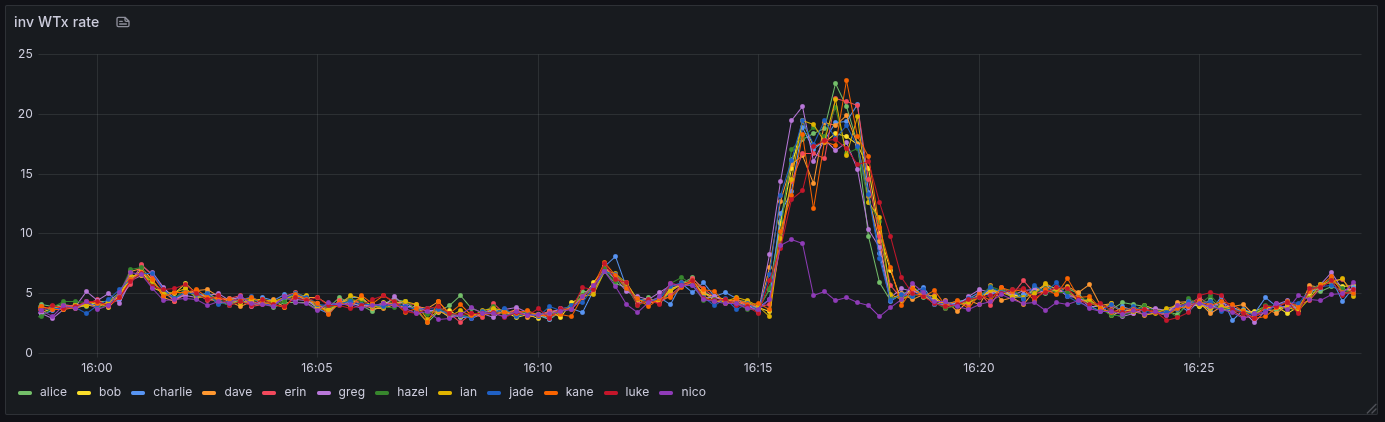
Additionally, I’ve set up data collection for inv rate, size and WTx annoucement rate by having a custom measurement client the Bitcoin Core node connects to with -addnode (i.e. manual outbound).
The rate of WTx inventory items I receive per second is around 5tx/s or just below most of the time, but I’ve seen spikes to 20-22/WTx invs per second. My understanding is that this could go up to 35/txs per second since #33448 (as these are outbound connections). The purple node not sending out WTx invs at the same rate as the others during the 16:15 spike is nico, which is a Knots node. Likely, the spike was a inscription (or similar) broadcast, which the node rejected and didn’t announce.
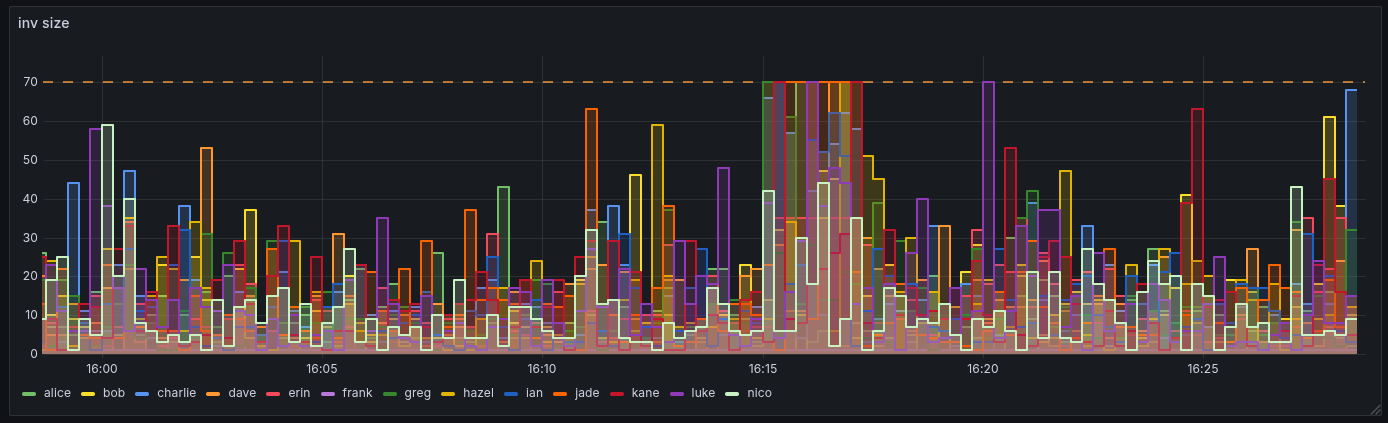
During the spikes, the inv size to my measuring client reaches 70 WTx per INV. That’s also expected, as INVENTORY_BROADCAST_TARGET = INVENTORY_BROADCAST_PER_SECOND * INBOUND_INVENTORY_BROADCAST_INTERVAL = 14 * 5 = 70. I have one peer running an older (pre 33488) version, and it sends only 35 INVs per second (that’s not really visible in the graph below). I haven’t seen this go over 70 (i.e. be dynamic) yet on my measurement client, but since it’s an outbound peer and we sent it INVs faster. I suspect it’s inv-to-send queue is a lot smaller than the inv-to-send queue of an inbound spy-peer.
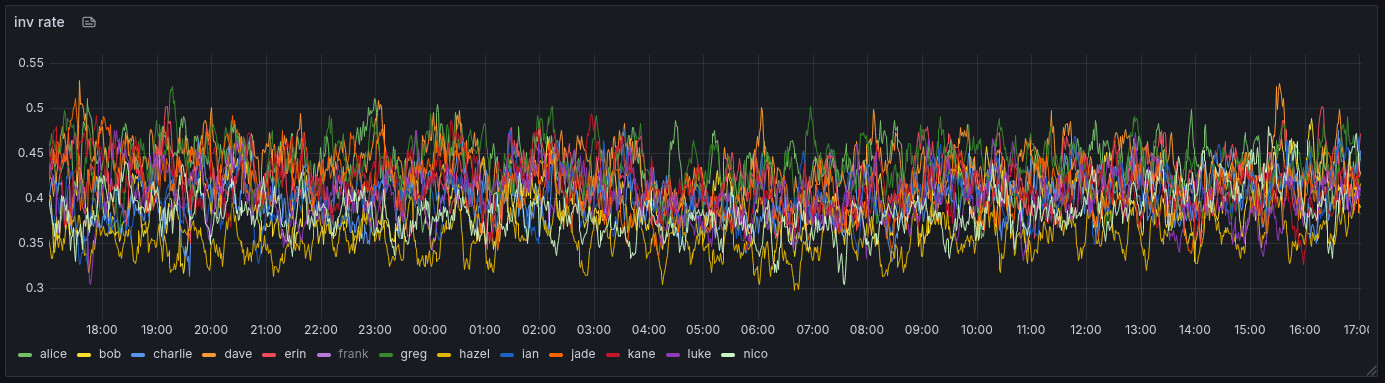
The rate at which the measurement client receives INVs is somewhere around 0.4 to 0.45 INVs/second. OUTBOUND_INVENTORY_BROADCAST_INTERVAL is 2 seconds which would indicate a 0.5 INVs/second rate, but since we don’t send INVs if our inv-to-send queue is empty, 0.45 INVs/second seems reasonable.