Small getaddr responses from 897 nodes (/Satoshi:27.0.0/ on AS63949)

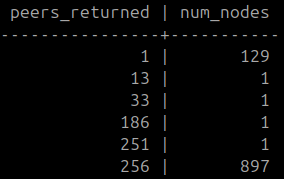
I ran this crawler(https://github.com/virtu/p2p-crawler.git) over the weekend and observed a cluster of 897 nodes that returned a getaddr response of 256 peers. This is way below the usual < 990.

All the nodes have the same user_agent, service, and version.

node_user_agent | node_version | node_services | num_nodes
------------------±-------------±--------------±----------
/Satoshi:27.0.0/ | 70016 | 3077 | 897

I attempted to cluster these 897 nodes based on shared peers.

Across all of them, the union is 2,006 distinct peers; none is unique to any single node in the group.

Every pair of cluster nodes shares between 16 and 60 peers, with most pairs at 31-35. No pair shares 100%.

I had initially thought these peers might be part of this → https://bnoc.xyz/t/python-bitcoinlib-0-12-2-client-getting-addr-ratelimited-since-2026-04-10/116

But most cluster addresses are hosted on Linode (Akamai Connected Cloud, AS63949), per ipinfo lookups. I think it’s a different set of addresses.

3 Likes

I noticed a bunch of /Satoshi:27.0.0/ nodes on Linode/AS63949 a few weeks ago too. While I didn’t notice the getaddr responses, I noticed that they will disconnect a connection after exactly 30s.

For example 172.105.78.137:8333

2 Likes

I noticed these nodes last February while trying to find mining pools on the network. They broadcast INVs where some items are duplicated in the INV message, don’t participate in transaction relay (if you relay them a tx), and respond to GETADDR with 256 addresses. My IP address ranges match also. Might need to scroll down in IRC logs, may be extra details there.

https://gnusha.org/bitcoin-core-dev/2025-02-03.log

https://gnusha.org/bitcoin-core-dev/2025-02-04.log

b10c edit:

15:16 < eugenesiegel> Would anybody know why specifically v27.0 nodes would disconnect inbound connections for not writing after 30 seconds? It doesn't happen with other versions and it happens with quite a few nodes. I didn't see anything in the changelog about any sort of write timeout being changed and I don't see anywhere in the code where a 30 second  timeout is
15:16 < eugenesiegel> used. Additionally, if I write a spam message on the connection, the node doesn't disconnect me.
15:34 < sipa> eugenesiegel: and this doesn't happen with 26.0?
15:34 < sipa> also, have you tried 28.0?
15:39 < bitcoin-git> [bitcoin] tdb3 closed pull request #30941: test: simplify timewarp test (master...20240921_simplify_timewarp_tests) https://github.com/bitcoin/bitcoin/pull/30941
15:40 < eugenesiegel> I couldn't reproduce locally when I checked out v27.0.  It doesn't happen with remote nodes on 26.0 or 28.0, only nodes on 27.0 from what I can tell.  It's also about 800 of these 27.0 nodes
16:13 < lightlike> so they would reject all blocks-only connections they have as inbounds quickly?! is this dependent on v2 transport (BIP324) being used?
16:29 < eugenesiegel> I wrote a light client so it doesn't have v2 transport yet and doesn't do blocks-only connections (so I can't be certain if blocks only connections would be rejected). I can look at the version messages and see if maybe there's a correlation with nServices
16:34 < lightlike> i just mentioned those because with block-relay-only connections (pings every 2 minutes, blocks every 10 minutes, no addr or tx relay) there should be frequent intervals where no messages are exchanged for more than 30s.
17:47 < eugenesiegel> I did a little more digging. Each node offers the exact same service flags of "SFNodeNetwork|SFNodeBloom|SFNodeNetworkLimited|0x800" and they all have the same block height of 882,161
17:48 < eugenesiegel> I think the tip at measurement time was 882,199
17:54 < sipa> 0x800 = NODE_P2P_V2
17:54 < sipa> Weird that they're offering NODE_BLOOM; that's not on in Bitcoin Core by default
18:11 < eugenesiegel> I found the BLOOM weird, the addresses are grouped into about seven /16 blocks
19:36 < sipa> is this linkinglion or some spy?
21:13 < eugenesiegel> I don't think its linkinglion, but I do think they're probably all the same entity. I tested on my mainnet node and v2 handshakes to them fail and are downgraded to v1 handshakes and then fail 30s later. The nodes ignore the sent feefilter and send INV messages always with 50 items and duplicate some of the items in the set. They also have other
21:13 < eugenesiegel> idiosyncrasies like not responding to GETDATA
21:22 < eugenesiegel> They also duplicate hashes _across_ different INVs and waste bandwidth.  The main IP ranges are 139.162.0.0/16, 172.104.0.0/16, 172.105.0.0/16, 172.232.0.0/16, 172.233.0.0/16, 172.234.0.0/16, and 172.236.0.0/16 if anybody is curious. I guess I answered my own question about these nodes since this behavior doesn't indicate a normal 27.0 satoshi
21:22 < eugenesiegel> node
21:32 < lightlike> yes, probably not core nodes, but definitely interesting, 800 is not nothing!
--- Log closed Tue Feb 04 00:00:08 2025
11:28 < eugenesiegel> > seeing a few of these connections too with the same characteristics you mention
11:28 < eugenesiegel> They respond to GETADDR and respond with 256 addresses of all of their addresses, so I think all of their nodes are pretty easy to identify. I think it's some sort of tx broadcasting / relay infrastructure
11:29 < eugenesiegel> * 256 of their addresses
4 Likes

The getaddr response + inv pattern does make these nodes weird. I’ve been thinking, okay, this is weird, but is it misbehavior? And even if we did treat it as misbehavior, they wouldn’t be banned, just discouraged. Still, this is a big number, and possibly growing

slightly related to GETADDR response size but not the same issue. was looking for GETADDR responses which were <1000 addresses and came across a cluster which sent 850 - 900 addresses as GETADDR response instead of the expected 1000 addresses.

weirdest thing about it is that it is still online and all their chain tip is stuck in 2010!

2 Likes

came across /Satoshi:27.0.0/ nodes on Linode/AS63949 as well. 2,006 IPs and half of them seem dead.

all of them:

  • on block height 0
  • send exactly 256 addresses as GETADDR response. every address in the response have:
    • timestamp = now
    • are also part of this linode cluster

they’re also in ~0.2% of the new table but ~6% of the tried table (most are ~6% but seeing 2-10% range) of different addrman snapshots in peer.observer. it didn’t exist in 2024.

these linode nodes seem to be the IPv4 celebs - the most seen ipv4 addresses in GETADDR responses when running virtu’s crawler. The overall top 5000 are almost entirely onion addresses - only 9 IPv4 nodes break into that top 5000 and all 9 are from this cluster.

These IPs might be good candidates for GitHub - bitcoin-noc/banlist: An optional, centralized, and incomplete banlist containing the IP addresses of possibly malicious entities on the Bitcoin network. · GitHub

1 Like

Does that mean that those nodes are doing more frequent self-advertisements than core, or something else?

1 Like

this is just analysing the response to GETADDR requests from the network btw. the crawler tried to find all the reachable nodes on the network and sends each of them a GETADDR request and receives the response. I just sorted the individual ADDR responses received based on the count from highest to lowest to decide the celebs.

Does that mean that those nodes are doing more frequent self-advertisements than core, or something else?

@ajtowns, I think it’s a mix of:

  1. the fleet controlling many IPs
  2. having made it’s way into so many address managers in the real network (and even into tried tables without running a real node (block height = 0) because this linode fleet has listen=1 and can accept inbound connections)

ex: 170.187.181.185 was seen in the GETADDR response of 114 members of it’s own fleet. but 301 nodes on the real network not part of this fleet also sent it in it’s GETADDR response!

tried connecting to one ip from a fully synced node (it disconnected me when I wasn’t caught to the tip). basically this just kept happening in a loop: the linode node announces transactions, we send it GETDATA, it doesn’t respond and then seeing timeout of inflight tx . I didn’t connect long enough to see if it does more self advertisement later.

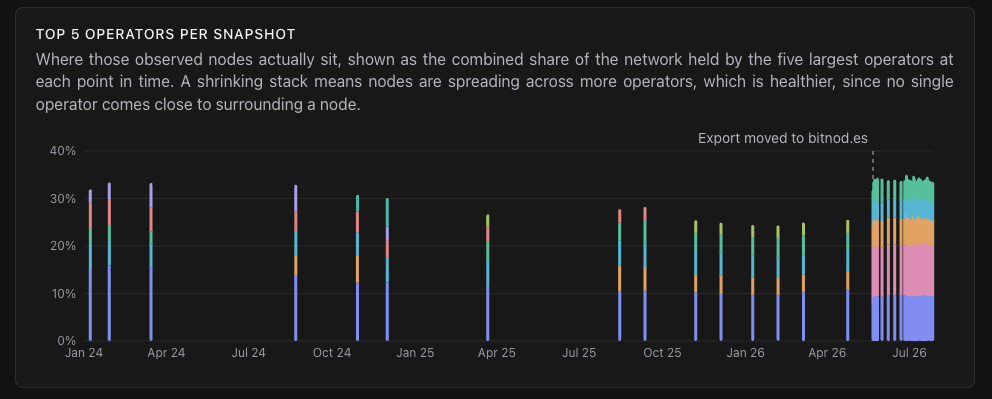
I also came across these hosts while investigating a discontinuity in the AS-level concentration metrics on the ASmap dashboard.

After bitnodes.io went offline, I changed the data source for the dashboard to bitnod.es. The first bitnod.es snapshot used by the dashboard is from May 22. At that point, the combined share of the five largest ASes jumps, and AS63949 (Linode) becomes the largest AS by observed clearnet host count.

The difference is also visible in the underlying snapshots, including the btcnodes snapshot:

Source Snapshot Clearnet hosts AS63949 hosts Share of population
historical bitnodes.io 2026-04-23 8,515 18 0.2%
bitnod.es 2026-05-22 9,599 1,029 10.7%
btcnodes 2026-05-22 9,371 1,027 11.0%

As Crypt-iQ noted above, these hosts have been visible since at least February 2025. Since bitnod.es and btcnodes both contain roughly the same population, I did not understand why the historical bitnodes.io exports contained almost none of them. I therefore checked the public crawler code, but that raised another question for me.

In the public ayeowch/bitnodes ping.py, the first keepalive ping is sent no earlier than 60 seconds after the connection is established:

self.ping_delay = 60
self.min_ping_delay = 60
self.max_ping_delay = 600

But in my probes, these AS63949 hosts disconnected after about 30 seconds of idle time, matching what b10c noted above. Since the public export is built from opendata, which contains currently open connections, this offers a straightforward explanation for why the historical bitnodes.io exports usually missed them.

What I do not understand is why btcnodes still contains these hosts even though its public ping.py and default ping configuration match the original ayeowch code (brunneis/btcnodes fork). bitnod.es states that it also uses the same crawler, but I cannot find its production code, so I cannot make the same comparison. My best guess is that the worker-pool state, reconnect cadence, production deployment, or export process differs from the historical bitnodes.io deployment. These are only guesses, though. Does anyone have a better explanation?

For the dashboard, I decided to exclude hosts matching this signature from the operator-concentration metrics because counting them as ordinary Bitcoin nodes would distort those metrics.

I would be interested in how others in this thread would handle these hosts in network-wide node counts or concentration metrics, and whether anyone can explain the difference between the historical bitnodes.io exports and the newer datasets.
1 Like

I had the impression that ayeowch manually banned some subnets/IPs while bitnodes was active, but I don’t know for sure.

fwiw @stratospher opened add: /Satoshi:27.0.0/ on Linode by stratospher · Pull Request #2 · bitcoin-noc/banlist · GitHub to the banlist. I’ve yet to make a decision on having individual IPs in this list or just include the full IP ranges

There’s also an X thread on these IPs I came across here: Maximus Decimus Meridius #RunKnots #BIP110 on X: "Update. The following IP ranges show abnormal node counts: 172.234.* -&gt; 82 172.105.* -&gt; 92 172.236.* -&gt; 106 172.104.* -&gt; 112 139.162.* -&gt; 128 172.232.* -&gt; 129 172.233.* -&gt; 145" / X

The following IP ranges show abnormal node counts:
172.234.* → 82
172.105.* → 92
172.236.* → 106
172.104.* → 112
139.162.* → 128
172.232.* → 129
172.233.* → 145

which roughly matches what @Crypt-iQ reported in 2025 on IRC:

  • 139.162.0.0/16
  • 172.104.0.0/16
  • 172.105.0.0/16
  • 172.232.0.0/16
  • 172.233.0.0/16
  • 172.234.0.0/16
  • 172.236.0.0/16

Apparently, they now have a 31.x UA (but I haven’t checked this).