This is joint work with @mzumsande. It’s a companion piece to this post, digging into the data from the address spam attack. Below is a summary of our analysis.
The address spam propagated through normal address gossip. You can see it in KIT’s “unique addresses per day” graph, which drops sharply in mid-July the moment the spammer stops. Sustaining that much volume takes active, continuous injection of addresses into the P2P network. In order for a node to relay an address onward: the ADDR message must carry 10 addresses or fewer, and the address timestamp must be less than 10 minutes old. This makes the spammer hard to identify (unless it connects directly to your node). It only has to reach a handful of peers; those peers relay to their peers, and the flood spreads across the network on its own.
-
We can watch that spread indirectly through the rising number of peers getting rate-limited. See discussion in this post.
-
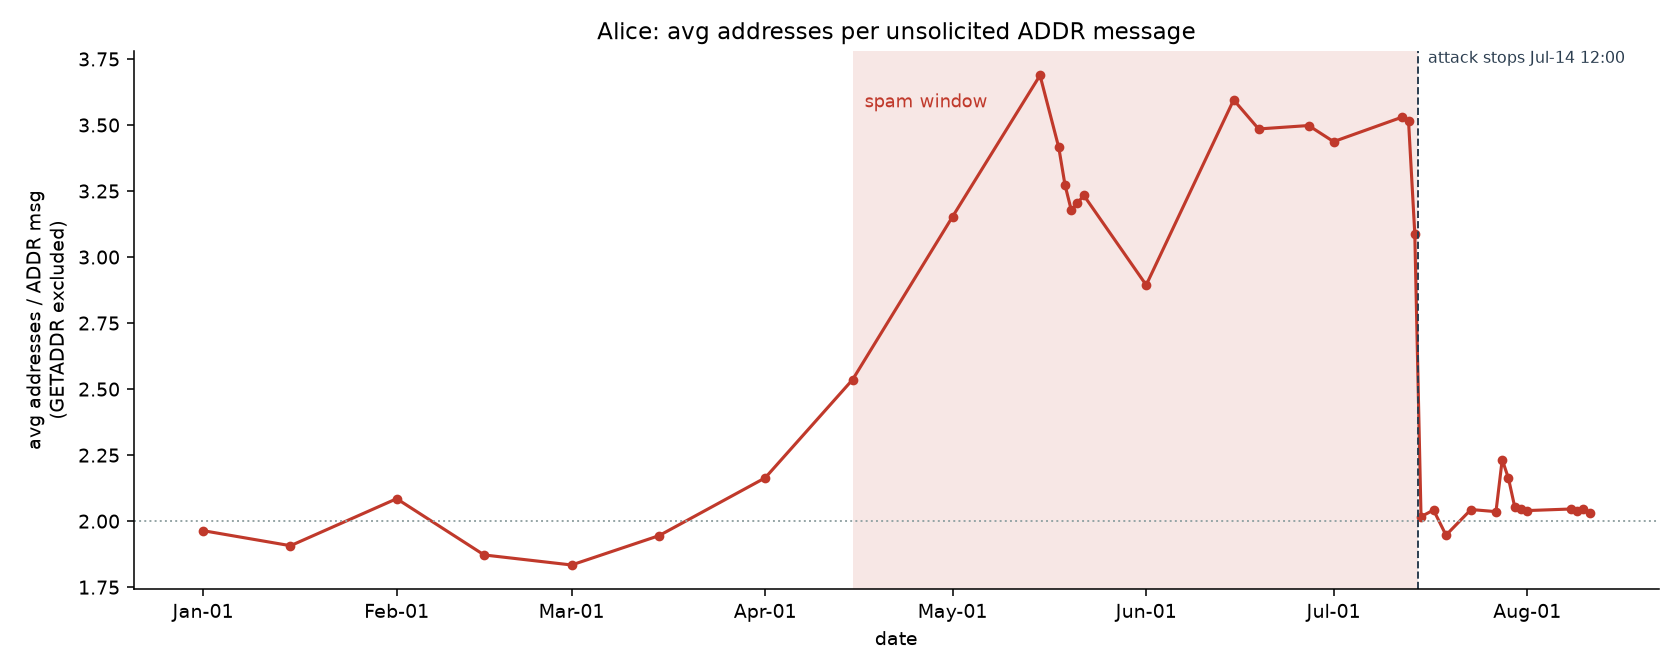
We see the average number of addresses per ADDR message climb over the same window.
-
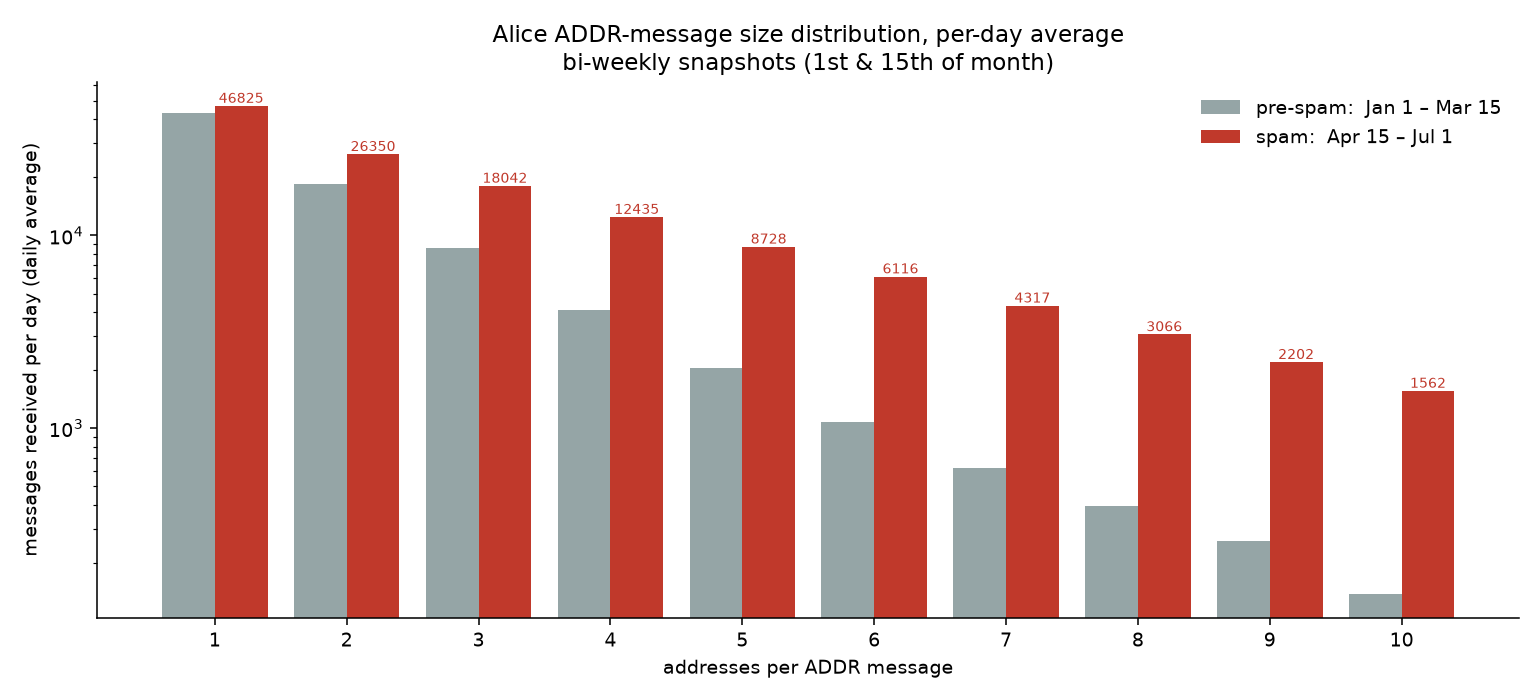
We also received far more multi-address ADDR messages per day during the spam period.
Once the attack stopped, the spam addresses became identifiable easier, because the spammer was no longer refreshing their timestamps. A fabricated address has no real node behind it to re-announce itself - only the spammer’s continuous gossip kept its timestamp current. When that stopped, the timestamps froze in place.
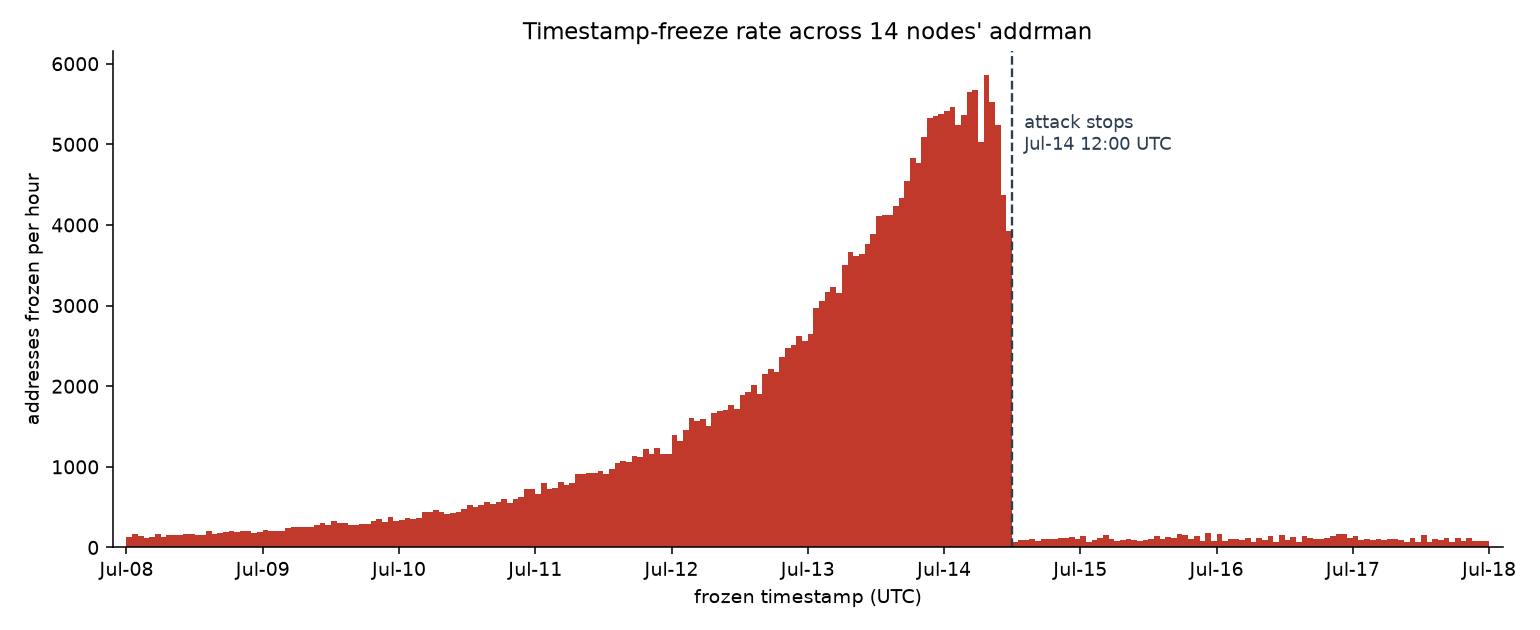
To measure this, we took 15 addrman snapshots from June 28 to August 12 across the 14 nodes (peer.observer) and, for every address, found the last snapshot in which its timestamp still advanced. Binning those “freeze times” by hour and applying some more strict checks (like counting an address only if it appears in at least 2 snapshots etc..) produced the following histogram.
The freeze shows up as a sharp cliff. Across the addrman of 14 nodes, the rate at which addresses’ timestamps stopped advancing collapsed ~60× in a single hour - from ~3,900/hour to ~65/hour at ~Jul-14 12:00 UTC.
Addr spam effects
Now coming to the effects of the addr spam.
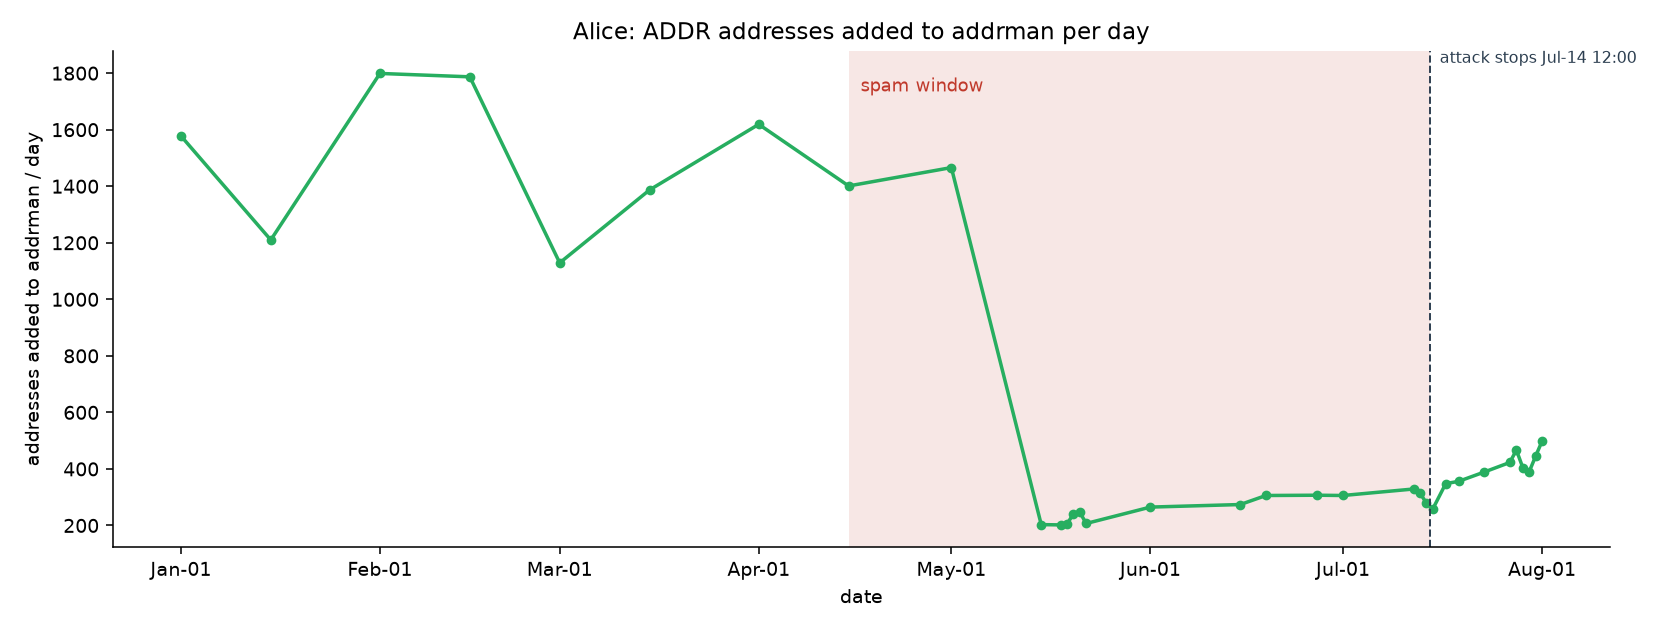
During the attack, the number of new addresses added to addrman per day dropped sharply. Alice held near its ~1,100–1,800/day baseline through late April, then fell to about ~200/day by early-to-mid May and stayed there for the rest of the spam window before creeping back toward ~400–500/day once the attack stopped. The graph misses data between April 15 and May 1, which would show us how many addresses were actually being inserted into addrman when the spam just started.
The drop is probably because the new table had already been filled with spam, so an incoming address usually hashed to a slot already held by a spam IP address entry the node couldn’t evict.
We had to wait about ~1 week after the spam stopped for the self-announcement of a newly started node to be accepted into the 14 addrmans we were watching on peer.observer - partly because the congested gossip meant a legitimate address relayed alongside spam could get rate-limited before a peer processed it, but mostly because peers’ new tables were full of fresh spam that addrman won’t evict until 30 days after the attack ends. Either way, legitimate addresses had a low chance of being accepted.
If we compare the outbound connection attempts (full relay and block relay but not feeler) and whether the outbound peer was chosen from the new table or tried table.
We see that the % of successful connection in the new table:
- before addr spam: ~1.4–3.7%
- during addr spam: ~0.6–1.9%
We see that the % of successful connection in the tried table:
- before addr spam: ~40–76%
- during addr spam: ~38–49%
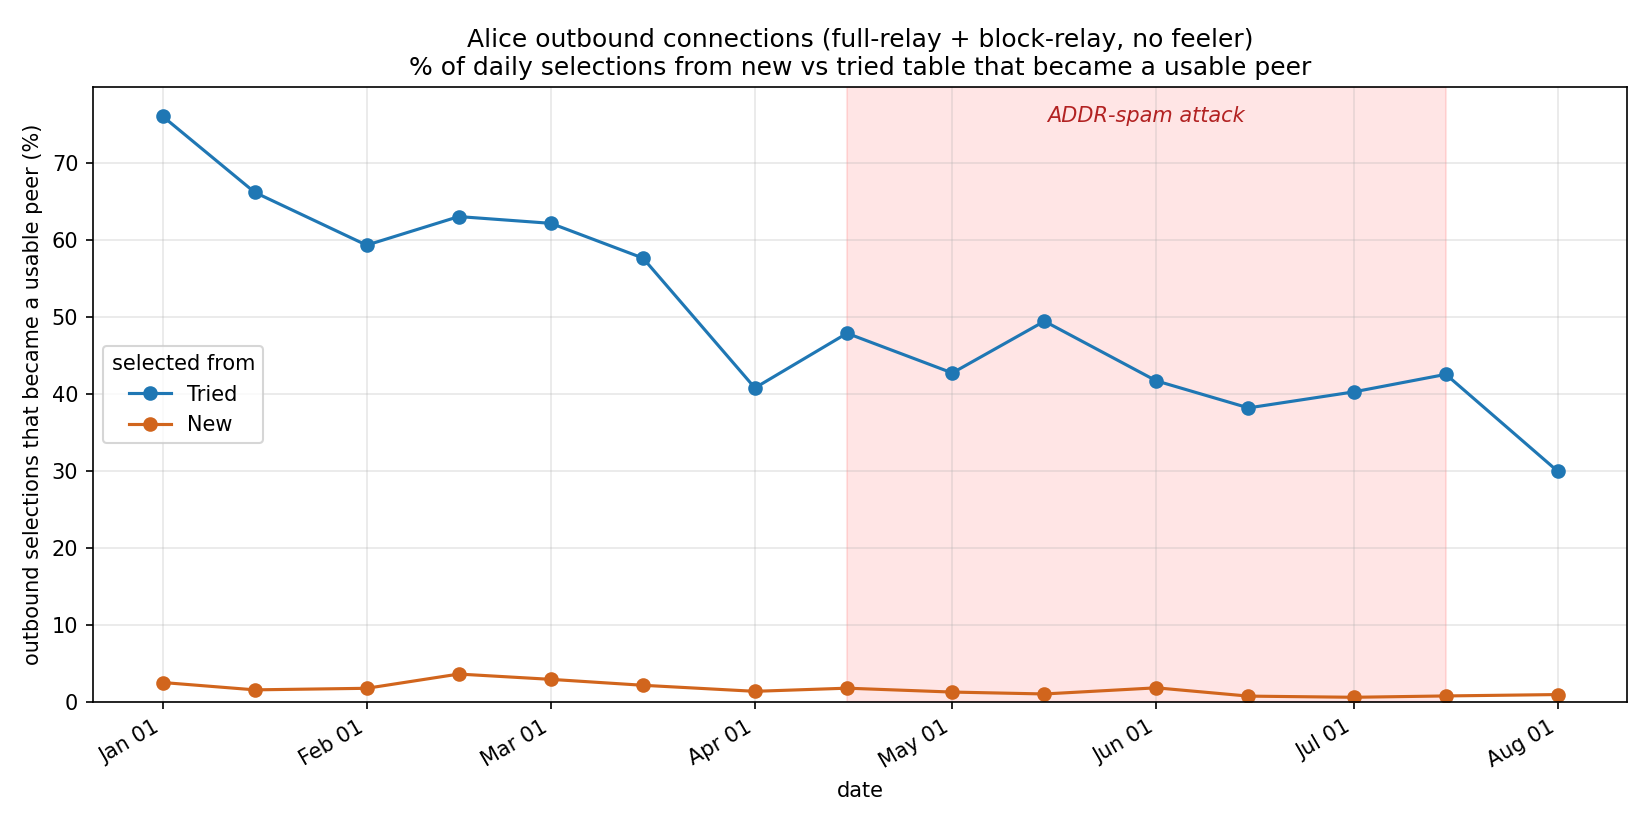
On a clearnet-only node, the New table’s success rate at producing a usable peer only dips slightly during the spam in absolute terms but it was already low to begin with. The New table was probably full of unreachable addresses before the attack even started.
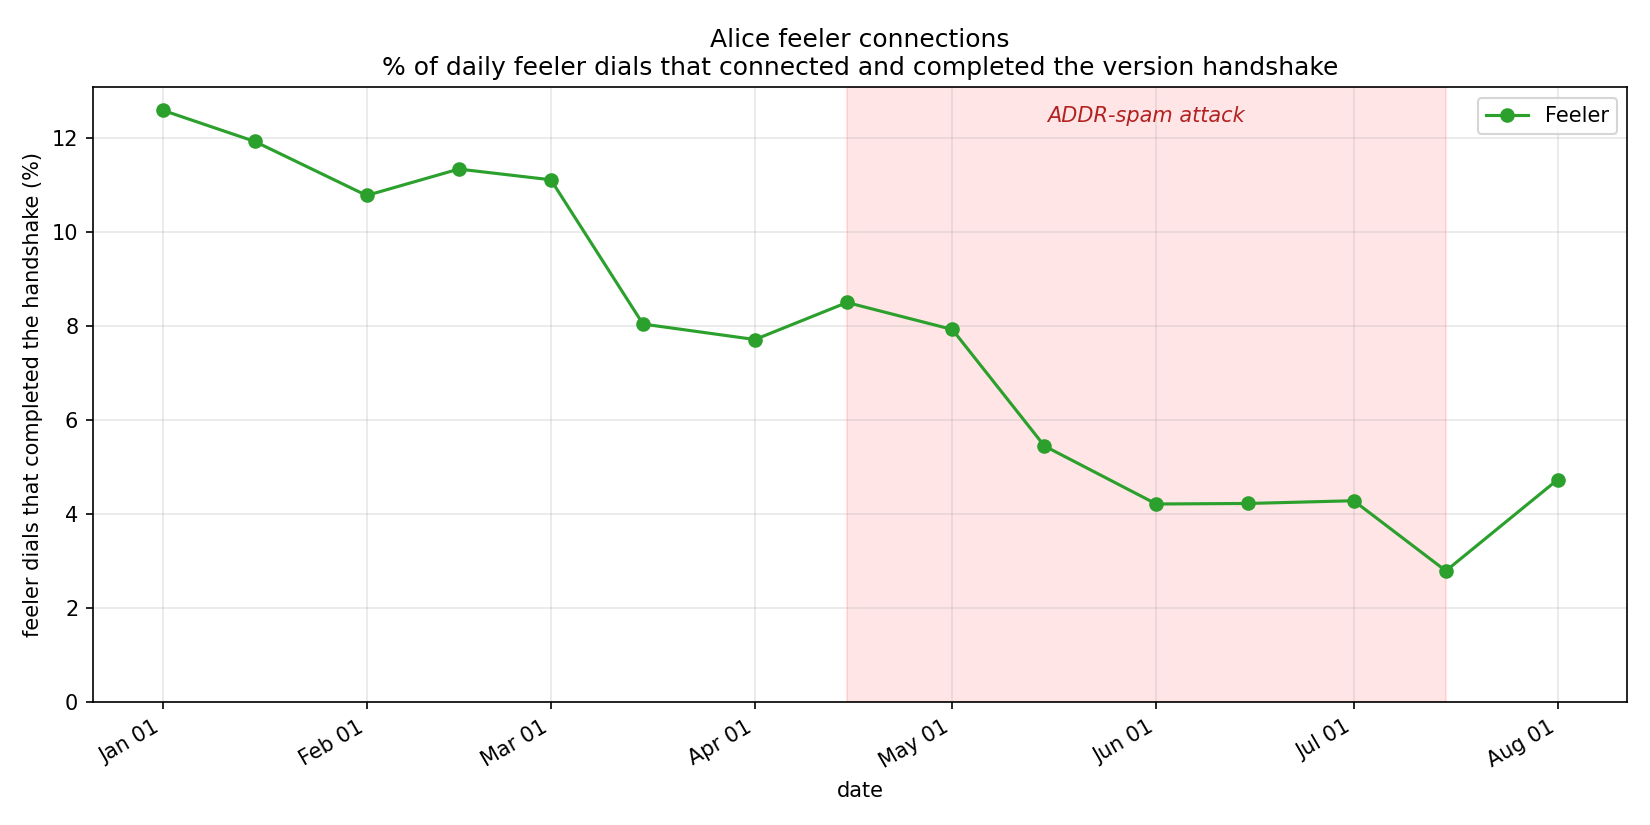
Feelers tell the story more clearly. A feeler dials a New-table entry to test whether it’s actually reachable, so feeler success is an indicator about the New-table quality. Feeler success was already sliding before the spam (12.6% in January down to ~8% by April - maybe because bitprojects left), then fell further through the spam window:
- before the spam: ~7.7–12.6%
- during the spam: ~2.8–8.5%
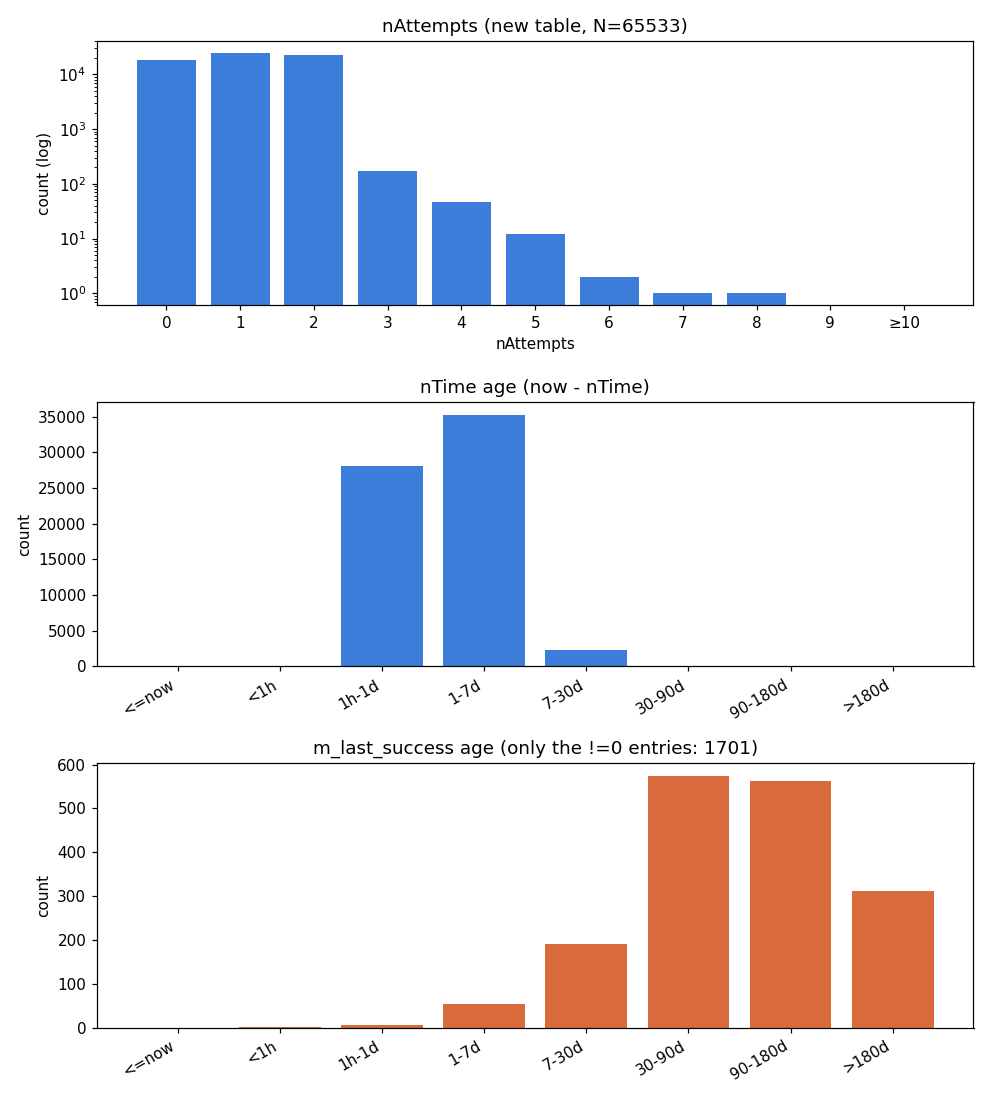
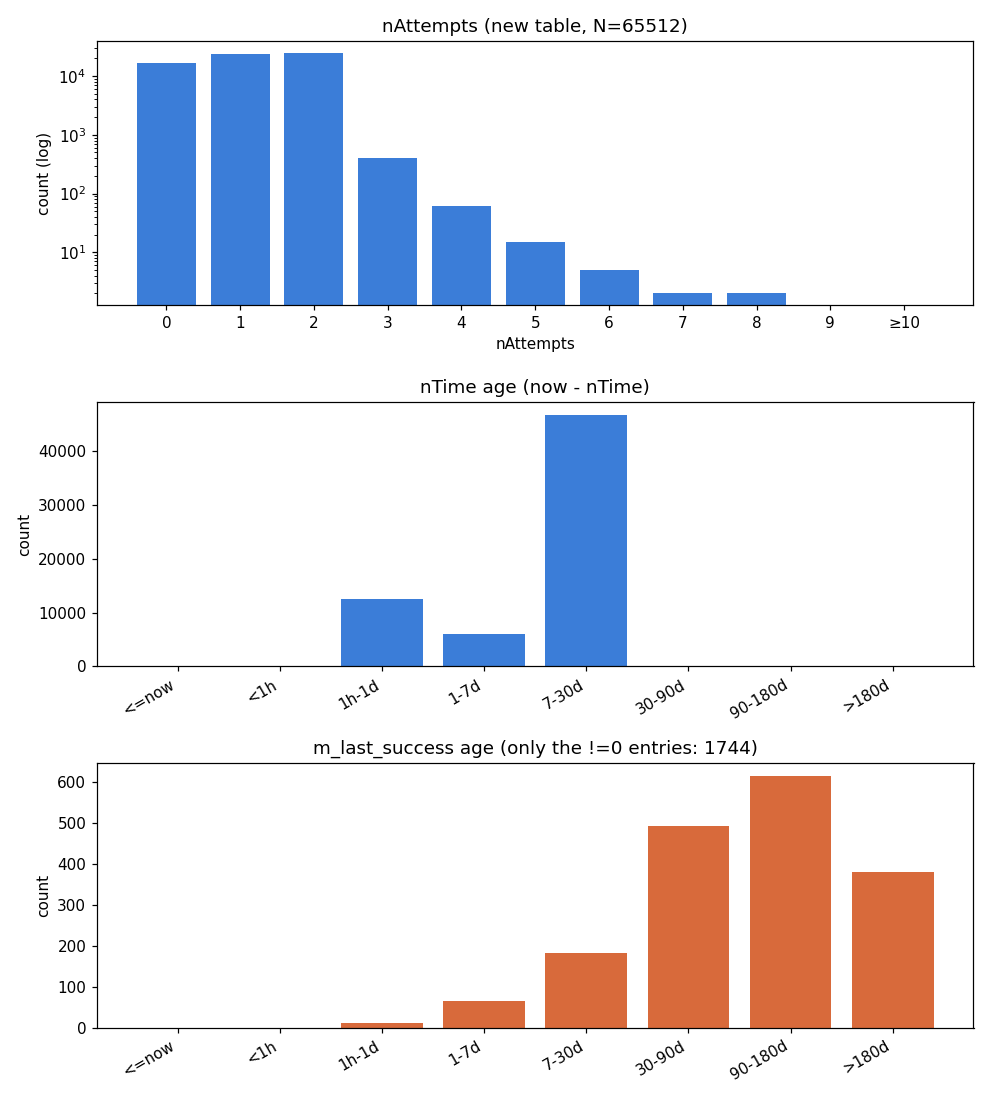
A healthy addrman needs ways for good addresses to stay and ways for bad ones to be evicted. Eviction is governed by IsTerrible, which marks an entry as removable mostly based on nTime (when the address was last seen), nAttempts (how many times we’ve tried to connect and failed) and m_last_success (when we last connected successfully).
nAttempts: it doesn’t change that much. There’s a sharp drop fromnAttempts = 2tonAttempts = 3and that’s because ofisTerriblerules.
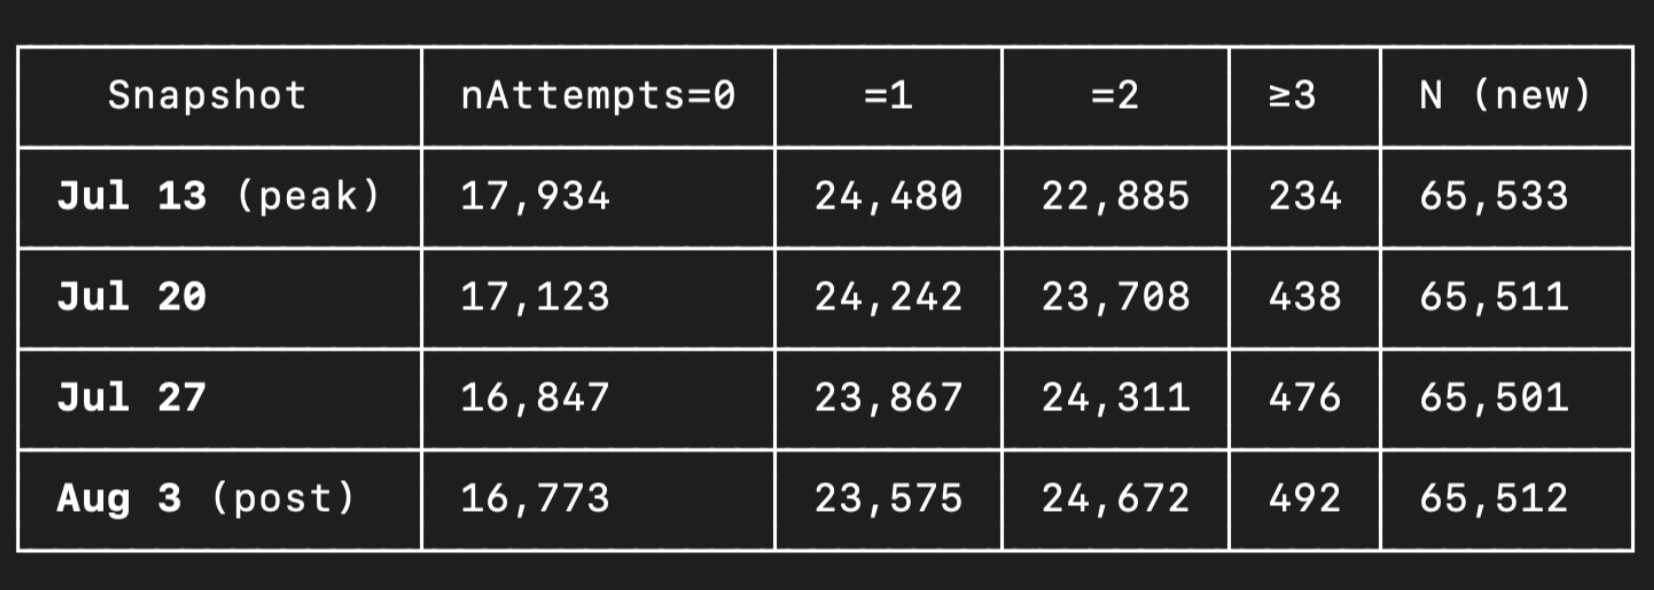
nTime: at the spam peak, almost every new-table entry is fresh and was last seen within the past 7 days. That constant refreshing is consistent with the spammer actively re-circulating the same addresses.m_last_success: only ~1.7k are IP addresses we ever successfully connected to and that number didn’t change much.
Acknowledgements
Special thanks to @b10c for maintaining peer.observer so well - the long-running, accessible data is what made this analysis possible! And thanks to @naiyoma for reviewing this post.